Relatively strong indicators, English is Relate Stringth Index, Abbreviation RSI It is a momentum index that measures the speed and change rate of the stock price.
The relatively strong indicators are proposed by Jone Welles Wilder Jr..The stock price growth or loss value within a certain period of time uses a certain calculation formula to obtain a value from 0 to 100.
It is generally believed that when the relatively strong indicators exceed more than 70 When the stock is in Overwhelm(( Overbought) Status, the stock price is overestimated; when the relatively weak indicators are lower than 30 At the time, the stock is in Overtime(( Oversold) Status, stock price is underestimated.
The scope value of the 30/70 can sometimes be adjusted according to the trend of the stock price, such as adjustment to 20/80.
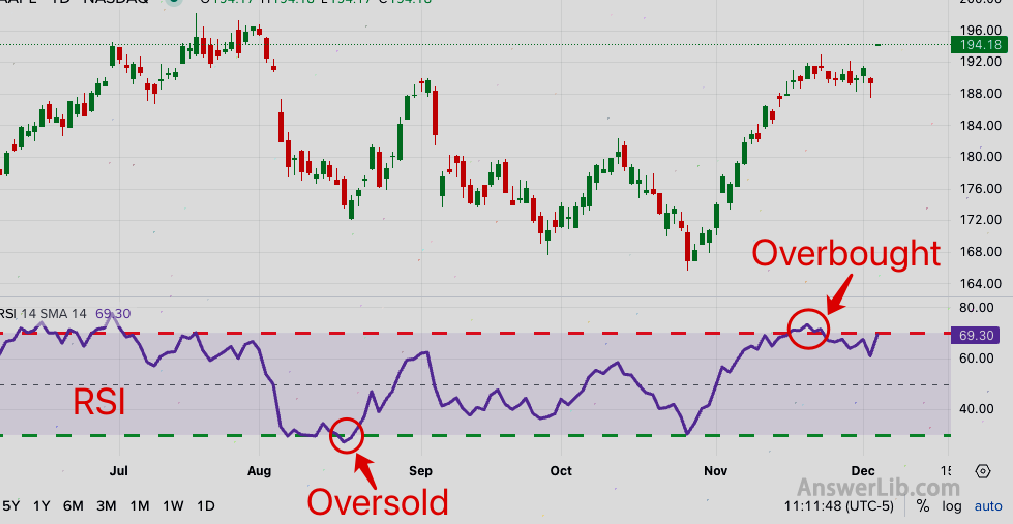
In most cases, the trend of RSI will match the trend of the stock price, but sometimes there will also be departure, and investors need sufficient experience to evaluate the price fluctuations indicated by this trend.
It should be noted that the calculation of relatively strong and weak indicators only uses the stock price profit and loss data for a period of time.Therefore, when you evaluate a shares, you still need to combine more financial indicators to make comprehensive judgments.
Bleak American broker:Ying Diandai 劵| | Futu Moomoo| | Microex Securities| | Tiger securities| | First securities| | Robinhood in
This article uses Apple stock AAPL as a demonstration.The stock is used as a demonstration content, not to guide you to buy the stock.Remember: the stock market is risky and investment needs to be cautious.
Directory of this article
- How to calculate the relatively strong indicators?
- How to calculate Apple’s relative auspicious indicators?
- What is the significance of investment guidance for relatively strong and weak indicators?
- What are the limitations of the relatively strong indicators?
- How to view the relatively strong indicators in IBRK?
- More concepts of US stocks
How to calculate the relatively strong indicators?
The calculation method of relatively strong indicators is as follows:
Relative strength indicators = 100 – 100 / (1 + stock price rising average / stock price decline average)
RSI = 100 – 100 / (1 + Average of Upward Price Change / Average of Download Price Change)
in:
- The cycle of the calculation average is usually 14 days;
- The average decline in the stock price is positively, that is, if the stock price drops by an average of $ 1.5, it will be 1.5 instead of-1.5;
- When calculating the average value of the stock price, the value of the stock price decline is 0, and the amount of all stock prices will be added after all the amount of all stock prices will be added.Similarly, when calculating the average value of the stock price decline, the value of the stock price rising days will not be calculated.For 0, after all the amount of all the stock price declines, it will be divided by 14.
How to calculate Apple’s relative auspicious indicators?
This chapter will use Apple’s company Investment portal website The historic stock price obtained on the previous RSI value is calculated:
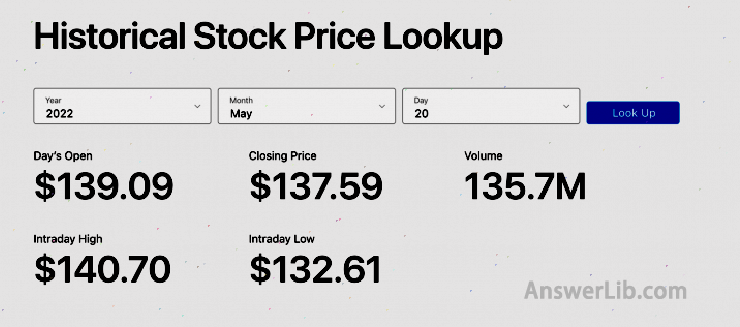
Use the price of the day to reduce the opening price to calculate the amount or decline of the stock price on the day:
| date | Closing price ($) |
rise ($) |
Decline ($) |
|---|---|---|---|
|
5/2/2022 |
157.96 |
||
|
5/3/2022 |
159.48 |
1.52 |
|
|
5/4/2022 |
166.03 |
6.55 |
|
|
5/5/2022 |
156.77 |
9.26 | |
|
5/6/2022 |
157.28 |
0.51 |
|
|
5/9/2022 |
152.06 |
5.22 |
|
|
5/10/2022 |
154.51 |
2.45 | |
|
5/11/2022 |
146.50 |
8.01 |
|
|
5/12/2022 |
142.56 |
3.94 |
|
|
5/13/2022 |
147.11 |
4.55 | |
|
5/16/2022 |
145.54 |
1.57 | |
|
5/17/2022 |
149.24 |
3.7 |
|
|
5/18/2022 |
140.82 |
8.42 |
|
|
5/19/2022 |
137.35 |
3.47 | |
|
5/20/2022 |
137.59 |
0.24 | |
|
total |
19.52 |
39.89 |
so:
- The average value of the stock price is: $ 19.52 / 14 = $ 1.394
- The average value of the stock price is: $ 39.89 / 14 = $ 9.973
so:
Relative strength indicators = 100 – 100 / (1 + average of stock price increase / average value of stock price decline)
RSI = 100 – 100 / (1 + Average of Upward Price Change / Average of Download Price Change)
= 100 – 100 / (1 + $ 1.394 / $ 9.973) = 12.26
It can be seen from the above calculations that the current Apple stock price is in the oversold stage (<30).
What is the significance of investment guidance for relatively strong and weak indicators?
Relative Streangth INDEX (RSI) is a popular technical analysis tool that is mainly used to evaluate the conditions for excessive buying or excessive selling of stocks or other financial assets.
Here are several commonly used application scenarios to judge the market trend:
1.Overbought or oversold (oversold)
When the RSI is higher than 70, the stock is considered to be in an overbought state, that is, the current number of buyers at the current stock is greater than the number of sellers, showing a strong rise.
When the RSI is lower than 30, the stock is considered to be in an oversold, that is, the current number of sellers of the stock is greater than the number of buyers.The stock price is underestimated, which is a good time for some investors to make “low buying and selling” investment.
For the combination of the 30/70 index, you can adjust according to the actual trend of the stock price.For example, when the RSI value of a stock is at a level of about 70 for a long time, you can adjust the indicator to 80 to make the stock price trend judgment.You can adjust the downward indicators to 20 for a trend judgment.
2.DiverGence
RSI DIVERGENCENCE (RSI DIVERGENCENCE) refers to the inconsistency between the stock price trend and the RSI index when using a relatively strong index for technical analysis.This deviation is usually regarded as a potential trend reversal signal.
Disposter can be divided into two types: Bearish DiverGence and Bullish DiverGence.
The departure happened when the stock price was innovative, and the RSI did not reach a record high.This means that although the price is rising, the rising capacity weakens, which may indicate the decline in the stock price.
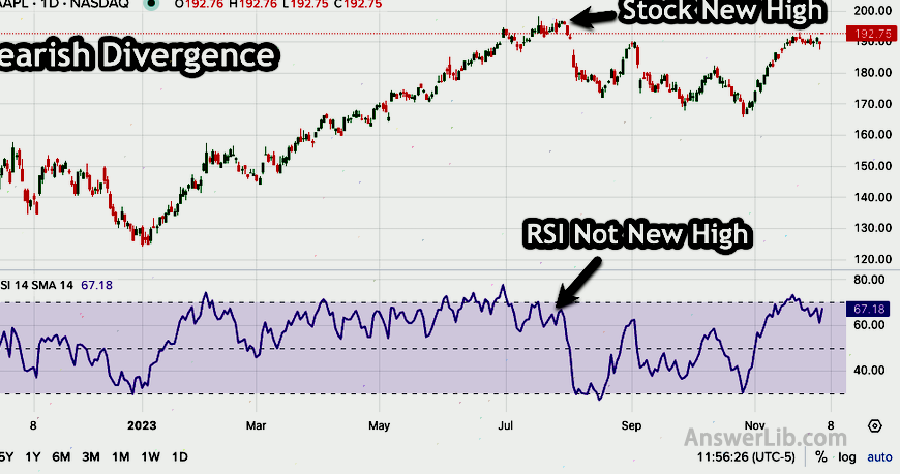
Cure
The departure of the bottom occurred at a low stock price low, and the RSI did not reach a new low.This shows that although the price is declining, the decline momentum is weakened, which may indicate the rise of the stock price.
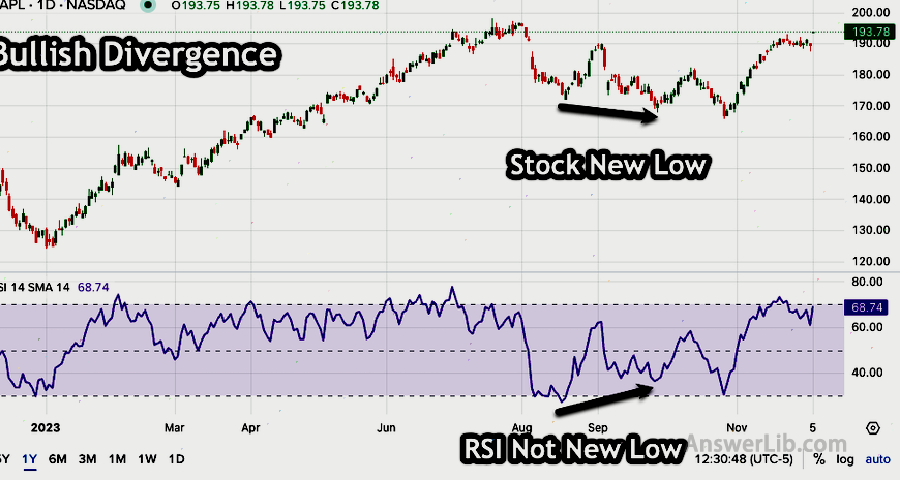
Cure
3.Failure Swing
Failure Swings is a special mode in the RSI indicator to predict the possible reversal of market trends.It is independent of price behavior and is based on changes in RSI values.
Failure swing can be divided into two types: Failure Swing Top and Failure Swing Bottom.
Failure to swing the top(Failure Swing Top): When the RSI first exceeds 70 (enter the super-buying area), then falls, then rises again, but fails to exceed the previous high, and then falls below the low point between these two highs., Form the top of the failed swing.This is regarded as selling signals, suggesting possible decline trends.From the perspective of the RSI graphics, its shape is similar to the letter “M”.
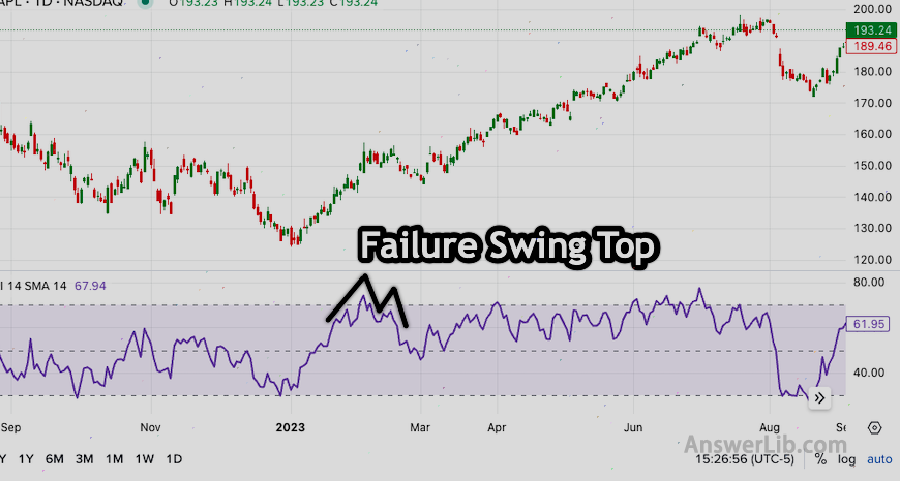
Cure
Failure to swing the bottom(Failure Swing Bottom): When RSI first fell below 30 (entering the oversold area), then rebounded, then fell again but failed to fall below the previous low, and then rose more than the high point between these two lows., Form the bottom of the failed swing.This is regarded as a buying signal, suggesting possible upward trends.The graphic shape of its RSI is similar to the letter “W”.
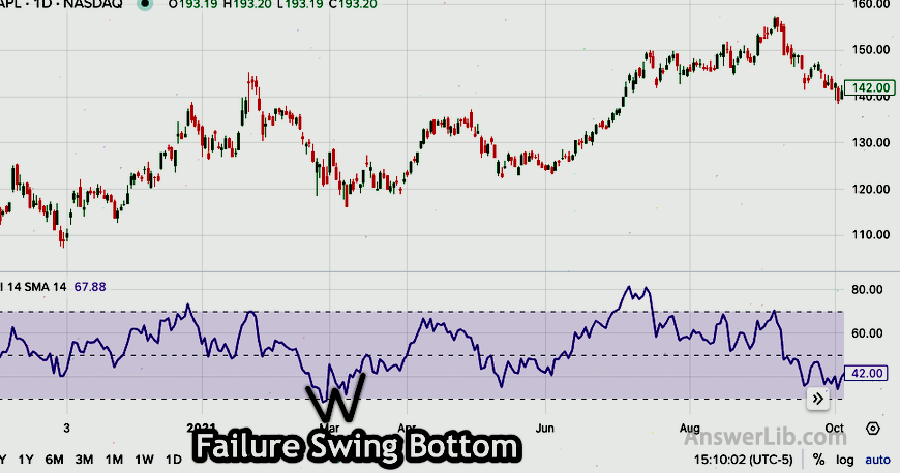
Cure
These two types of failures provide potential trading signals, but they need to be treated with caution.It is best to use other technical analysis tools to improve the accuracy of transaction decisions.
What are the limitations of the relatively strong indicators?
Relatively strong indicators (RSI) are a widely used technical analysis tool, but it also has some limitations.
Relatively strong indicators are usually more suitable for short-term investors.For investors who are accustomed to long-term investment, more company fundamentals need to be considered to evaluate the value of a stock, such as profitability and overall business capabilities.
The limitations of the relatively strong indicators are as follows:
- Over-buy/over-selling area misleading: RSI’s super buying (usually higher than 70) and over-selling (usually lower than 30) areas are not always accurate buying and selling signals.In a strong trend market, RSI may stay in these areas for a long time without necessarily.
- Failure in the trend market: In continuous bull markets or bear markets, RSI may have misleading signals.For example, in a strong upward trend, RSI may continue to display the oversseting state, misleading investors believe that the market is about to call back.
- Delay of the price departure signal: Although RSI departure can be a powerful market steering signal, they usually have delay.This means that the market may have reversed for a while when it is confirmed.
- Need to be used with other tools: RSI is best combined with other technical analysis tools and indicators to enhance the effectiveness of the signal.Using RSI alone may not be able to provide sufficient transaction signals.
- The subjectivity of parameter selection: The calculation of RSI depends on the time cycle of selection (such as 14 days, 10 days, etc.).Different parameter selection may lead to different results and increase the subjectivity of analysis.
How to view the relatively strong indicators in IBRK?
Realive Brokers It is an international merchant that provides extensive transaction and investment services, suitable for individuals, professional investors and institutional customers.
For a detailed introduction to Yingyou Certificate, please read the article “Ying Diabang Entry Gold and Investment Guide” Essence
Here is an IBRK online version as an example:
On the homepage, log in to your account.
Find the stock you are concerned about, take AAPL as an example.
Find the menu item [Indicators] in the candlestick.
Enter RSI in [Indicators] pop-up options.Select Relacted Stringth index index from the search results.
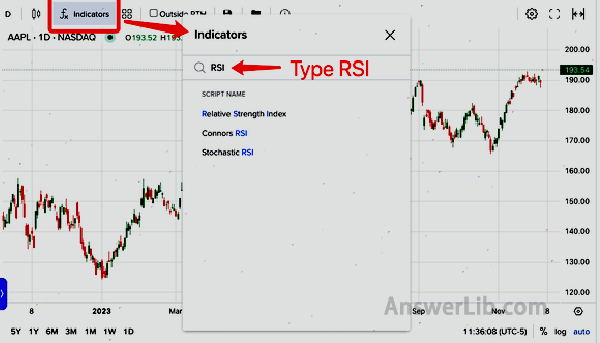
In this way, the candlestick chart will be displayed than the relatively strong indicators.
More concepts of US stocks
- Julian Roberts – Julian Robertson: Father of Tiger Baby
- Explore the 24 first-level dealers of the Federal Reserve
- Important Finance and Investment News
- What is Bollinger Bands?How to use the Bollinger belt?
- What is the application cumulative/allocation line? A/D Line
- What is the commodity channel index CCI?How to use the CCI indicator?
- What is a random shock index Stochastic ollator?
- What is the average trend indicator ADX?How to use the ADX indicator?
- What is a balanced transaction volume index?How to use the OBV indicator?
- What is a mobile average?MOVING AVERAGE
