US debt yield curve: Under normal circumstances, short-term U.S.Treasury bond interest rates are low, long-term government bond funds flow is limited, so interest rates are high.This is the phenomenon of a benign market.
However, it can be seen from the historical development that sometimes the short-term interest rate is higher than long-term interest rates, which is called “interest rate inverted”.The most important thing is that after such anomalous trend, economic recession often occurs.
As a result, analysts draw interest rate curves based on interest rate trends, and have made certain analysis and predictive trends on the market.What does the interest rate curve of investors mean?
Bleak American broker:Ying Diandai 劵| | Futu Moomoo| | Microex Securities| | Tiger securities| | First securities| | Robinhood in
Directory of this article
- What is the yield curve?
- What are the types of yield curves?
- Why does the interest rate inverted happen?
- What does interest rate inverted may indicate?
- How to track interest rates?
- What does interest rates hang in history?
- The yield curve in recent years
- common problem
What is the yield curve?
The yield curve, English is Yield Curve.It is a yield curve that draws bonds with the same credit quality but different periods.
According to the types of US bonds, it is divided into: January, February, March, June, 1, 2 years, 3 years, 5 years, 7 years, 10 years, 20 years, and 30 years.
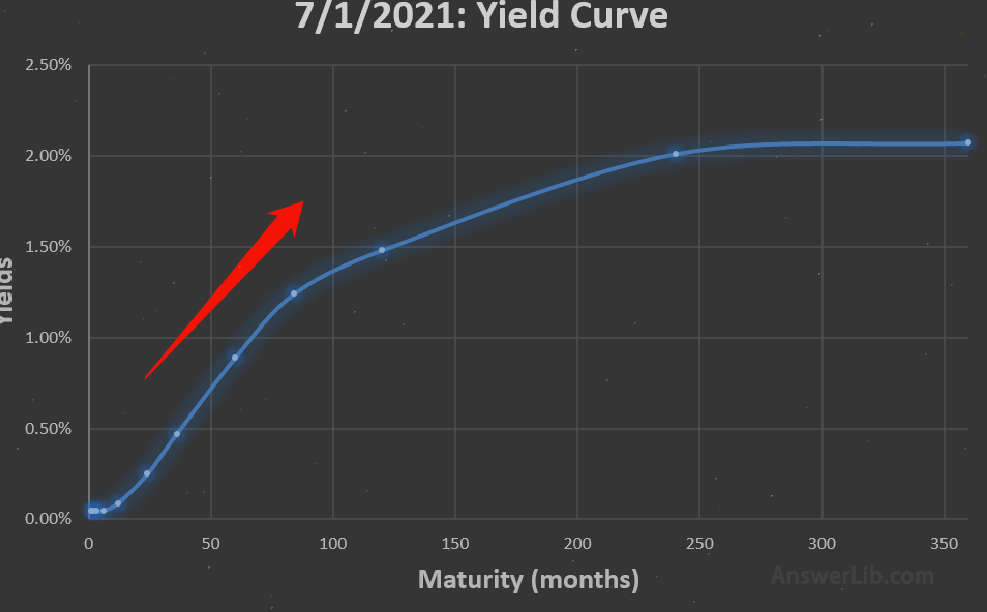
The yield of national bonds on July 1, 2021 is as follows:
- 1-month: 0.05%
- 2-month: 0.05%
- 3-month: 0.05%
- 6-month: 0.05%
- 1-year: 0.09%
- 2-year: 0.25%
- 3-year: 0.47%
- 5-year: 0.89%
- 7-year: 1.24%
- 10-year: 1.48%
- 20-year: 2.01%
- 30-year: 2.07%
Therefore, if you use horizontal coordinates to express the maturity of bonds (Maturity), use longitudinal coordinates to represent the corresponding yield percentage, then the drawn curve becomes a “yield curve”.
Note: The yield and historical yield of each trading day can be Ministry of Finance website Inquiry.
If investors buy long-term government bonds, due to long borrowing, investors usually get more benefits than short-term bonds.Therefore, under normal economic trends, the yield curve will be curved upward.
The yield curve is used as the benchmark for other debt interest rates in the market, such as mortgage interest rates or bank loan interest rates.
At the same time, the yield curve is also used to predict changes in economic output and growth.Normal curves often show that the economy is expanding forward, and the downward curve (inverted interest rate) indicates the economic recession.In the flat yield curve, the short-term and long-term yields are very close.
What are the types of yield curves?
There are three main types of yield curves:
- Normal yield curve, that is, the curve of the upward tilt
- Flat-straight yield curve
- The inverted yield curve, the curve of the downward tilt
1.Normal yield curve

This upward tilting yield curve is the most common in US Treasury bonds in government bond investment.
According to the model of Treasury bonds, the higher the risk of investors, the higher the benefits they obtain.Therefore, long-term interest rates are often higher than short-term interest rates.Therefore, it can be seen that along the X-axis, interest rates are growth trends.
For example, if the yield of two-year Treasury bonds is 1%, the yield rate of five-year bonds is 1.8%, the yield of 10 -year bonds is 2.5%, and the yield of 15 -year bonds is 3.0%, and 20 years of 20 years, and 20 years of 20 yearsThe yield rate of bonds is 3.5%.In this case, the interest rate of long-term government bonds is always higher than the interest rate of short-term Treasury bonds.
Normal yield curve means that the current stable economic situation, the steep yield curve means that investors believe that the future economy will grow strongly.
2.Flat-to -return rate curve

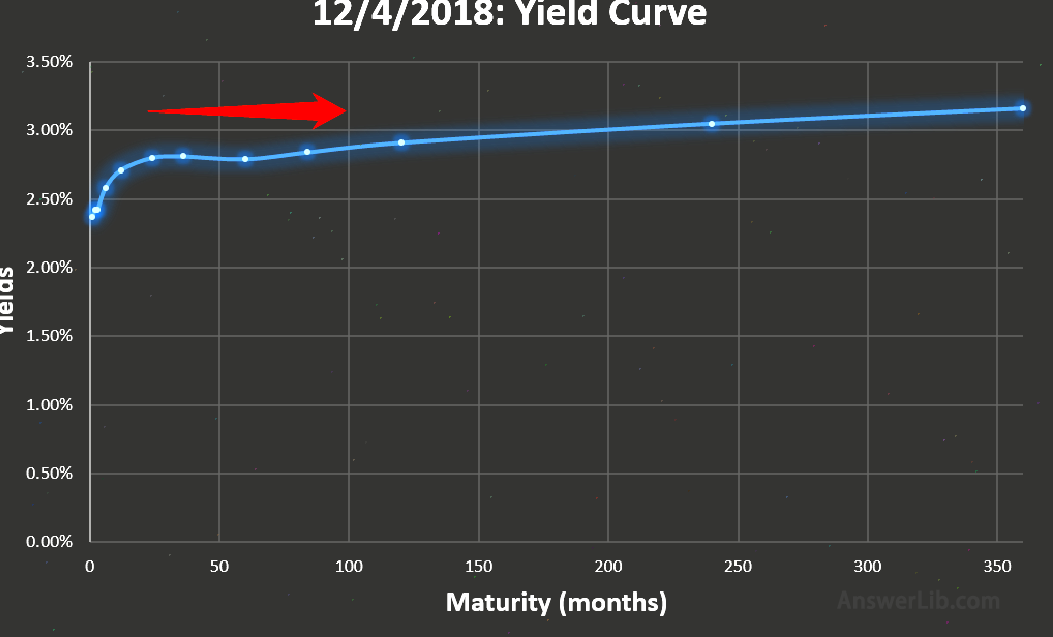
If the yield curve tends to be straight, that is, the yields of different from time to date are not much different.The straight yield curve shows that different periods of Treasury bonds of different periods.
For example, on December 4, 2018, the yield of the 1 -year Treasury bond was 2.71%, the three-year national debt was 2.81%, and the 5 -year national debt was 2.79%, which was not much different.This will cause a slight hump along the flat curve.
The yield curve of straight or middle-to -middle bulging means that the economic situation is unclear, indicating that the market believes that the Fed may cut interest rates to a certain extent to stimulate the economy.
In the case of unclear market situation, investors prefer a more average yield.
3.Inverted yield curve (inverted interest rate)

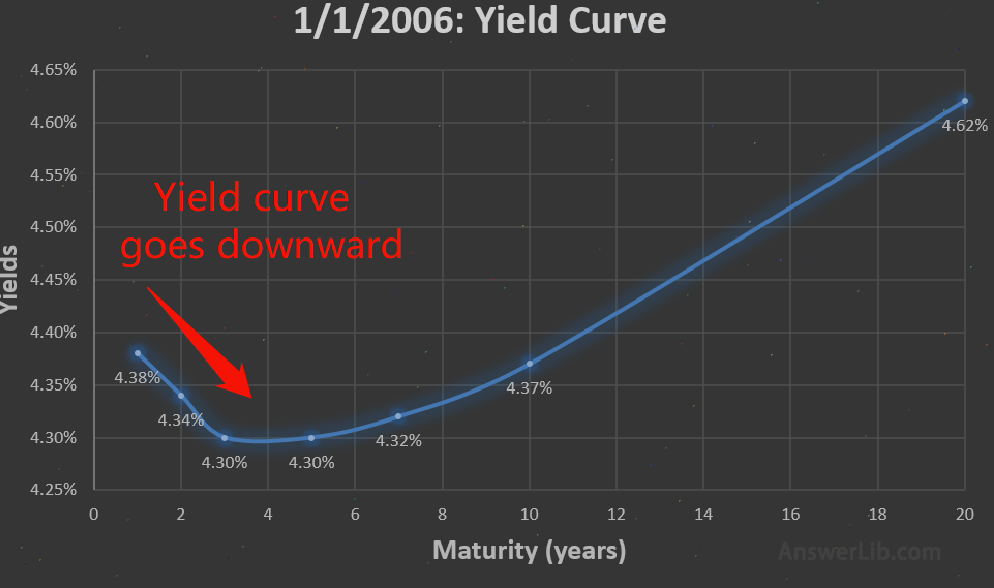
The backward yield curve is called an inverted curve.At this time, the short-term government bond yield is higher than the long-term national bond yield, which can also be understood as “interest rate inverted”.
For example, 10 -year Treasury bond yields are 4.37%, which is still less than one-year Treasury yield of 4.38%.
Interest rate inverted curve, English name: INVERTED YIELD CURVE.It is the interest rate curve of long-term bond interest rates lower than the short-term bond interest rate.This is an abnormal situation, usually heralding the upcoming economic stagnation or decline.
Infallment of interest rates is not common.From the perspective of historical data, inverted interest rates usually indicate that the economic development trend will seriously slow down or even retreat.At this time, the Fed may cut interest rates sharply to stimulate the economy and prevent currency tightening.
In addition, in the uncertain period of economic prospects, investors who seek security investment are more inclined to buy long-term bonds instead of short-term bonds, thereby increasing the price of long-term bonds, which will also lower their yields and have interest rates.
Why does the interest rate inverted happen?
The demand for bonds is linked to its yield.When demand is large, the government does not need to provide high interest rates to sell enough bonds, and bonds with small demand need to provide high interest rates to attract more investors.
In the normal economic environment, investors hope to flexibly invest in the short-term market.As a result, the short-term bond purchase volume is large, the interest rates are low, and the purchase volume of long-term bonds is relatively small and the interest rate is higher.
However, when investors lack confidence in the recent economy and believe that the economy will become bad in the short term, and the recent risk of investment is greater than long-term, investors are more willing to buy long-term national debt.
As investors purchase long-term bonds, the prices of these bonds are raised and their yields have begun to decline.The demand for short-term Treasury coupons declined, so the government attracted investors by providing higher yields, and eventually had interest rates.
What does interest rate inverted may indicate?
Interest rate inverted is a manifestation of investors’ lack of confidence in the recent economic market.
The relationship between the demand for bonds and the high and low interest rates, the high and low interest rate between different holding bonds is both a state of market economy development and a prediction of future economic trends.
When interest rates are upside down, that is, short-term bond interest rates rise and long-term bond interest rates have declined, indicating that investors are not optimistic about recent economic performance and are unwilling to invest in short-term bonds.It will get good returns, so the funds are transferred to long-term bonds.
Overall the short-term market atmosphere that is not optimistic about the short-term economy often indicates the possibility of the economic crisis in the near future.
But it is not as long as the interest rate is upside down, the economic recession will definitely occur.Occasionally the interest rate inverted may be due to some special circumstances that people change the investment strategy.This inverted interest rate will be turned over through the market’s self-regulation or slightly regulating policy to regulate to the policy to flip to it to the market to flip to it to the market to flip to it to the market to flip to it to it.Normal curve.
If the interest rate is upside down for a while, it may indicate the economic recession.When the interest rate inversion lasted for more than half a year, such as the interest rate of interest rates before the energy crisis in the 1980s, it lasted for more than two years, and it would become a clearer economic crisis expected indicator.And the longer the interest rate of interest rates, the greater the economic crisis.
During the inverted interest rate, the financial market is not necessarily turbulent, and the market turmoil will not occur after a few months after the interest rate is upside down.
How to track interest rates?
In addition to viewing the shape of the yield curve daily (normal, straight, or inverted), we can also track the difference between long-term national bonds and short-term government bonds.
For example, it can be a 10 -year Treasury bond (10 Year Bond Yield) represents long-term government bonds, and the 1 -year Treasury bond (1 year bond yield) represents short-term Treasury bonds, so as to monitor whether the difference between the two is less than 0.The calculation formula is as follows as follows.The
Yield Differente = 10 Year Bond Yield -1 Year Bond Yield
Here Yield Differenter <0 It can be considered that the interest rate of interest rates is an important warning signal.For short-term Treasury bonds, you can also use March Treasury yields or 2 -year Treasury yields for calculation.
The following is the poor income of 10 -year Treasury bonds and 1 -year Treasury bonds.
[amcharts id = “Cur-Inverted-Yield-Curve”]]
It can be seen from the figure that any curve below the red line is a part of the inverted interest rate.
What does interest rates hang in history?
The reason why interest rates are worrying are because of its predictability of the economic development history several times in the history of economic development.
- From 1978 to 1981, there was a continuous interest rate upside down.As a result, economic recession caused by the energy crisis from 1980 to 1982
- In the first half of 1989, the interest rates lasted for several months, so that in 1991, the economic recession caused the debt crisis.
- Instant interest rates in 2000, from 2001 to 2003, the economic recession caused economic recession due to the Internet bubble
- From December 2005 to 2007, interest rates were inverted, and then in 2008, in 2008, due to the severe economic recession due to the subprime mortgage crisis

Below the return on national bond yields before the financial crisis in 2008:
The first upside down occurred on December 22, 2005.At that time, the Fed was worried about the asset bubble of the real estate market and raised interest rates.In the market, the growth rate of two-year national debt yields was higher than the growth rate of 10 -year Treasury bonds.Investors were more willing to invest in ten-year Treasury bonds.The situation continued until July 2006.At that time, the 10 -year Treasury bond yield was 5.07%, and the two-year national bond yield was 5.12%.It will provide sufficient liquidity to the economy to prevent economic recession.When interest rates inverted until September 2007, the Fed finally began to worry and tried to stimulate the market through continuous interest rate cuts.It was not until the end of 2008 that the federal fund interest rate fell to zero, that is, borrowing money between banks did not need to pay interest to stimulate economic recovery, so that the yield curve was no longer inverted, but it was too late.The market economy has entered the worst period of recession since the Great Depression.
The yield curve in recent years
The recent interest rate inversion appeared in August 2019.The US Treasury yield curve appeared for the first time since the economic recession.At that time, the yield of 1 -year Treasury bond was 1.73%, which was 1.52%higher than the 10 -phase Treasury bond yield.

Risk aversion caused more investors to the US Treasury market.The Fed changed its position and started to cut interest rates, but investors were worried that the Sino -US trade war at that time would further lead to economic recession.
common problem
Question 1: What is the inverted interest rate?Interest rate inverted curve, English name: INVERTED YIELD CURVE.It is the interest rate curve of long-term bond interest rates lower than the short-term bond interest rate.This is an abnormal situation, usually heralding the upcoming economic stagnation or decline.
See More
The demand for bonds is linked to its yield.When demand is large, the government does not need to provide high interest rates to sell enough bonds, and bonds with small demand need to provide high interest rates to attract more investors.In the normal economic environment, investors hope to flexibly invest in the short-term market.As a result, the short-term bond purchase volume is large, the interest rates are low, and the purchase volume of long-term bonds is relatively small and the interest rate is higher.However, when investors lack confidence in the recent economy and believe that the economy will become bad in the short term, and the recent risk of investment is greater than long-term, investors are more willing to buy long-term national debt.
See More
Interest rate inverted is a manifestation of investors’ lack of confidence in the recent economic market.When interest rates are upside down, that is, short-term bond interest rates rise and long-term bond interest rates have declined, indicating that investors are not optimistic about recent economic performance and are unwilling to invest in short-term bonds.It will get good returns, so the funds are transferred to long-term bonds.Overall the short-term market atmosphere that is not optimistic about the short-term economy often indicates the possibility of the economic crisis in the near future.
See More
The reason why interest rates are worrying are because of its predictability of the economic development history several times in the history of economic development.
From 1978 to 1981, there was a continuous interest rate upside down.As a result, economic recession caused by the energy crisis from 1980 to 1982
In the first half of 1989, the interest rates lasted for several months, so that in 1991, the economic recession caused the debt crisis.
Instant interest rates in 2000, from 2001 to 2003, the economic recession caused economic recession due to the Internet bubble
From December 2005 to 2007, interest rates were inverted, and then in 2008, in 2008, due to the severe economic recession due to the subprime mortgage crisis
See More
