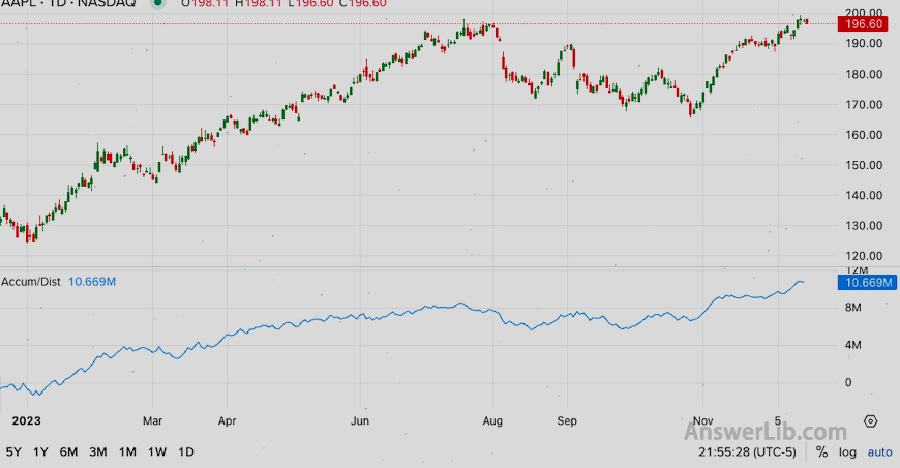
Application cumulative/allocation line, English is AcCUMULATION/Distribution line, Abbreviation A/d line It is a technical indicator that analyzes capital flow, which is used to evaluate the trend of capital inflowing and outflow.

The application cumulative/allocation line is proposed by the famous technical analyst Marc Chaikin.This indicator combines information and transaction volume information to analyze the market pressure and flow of funds.
Bleak American broker:Ying Diandai 劵| | Futu Moomoo| | Microex Securities| | Tiger securities| | First securities| | Robinhood in
Directory of this article
- What is the application cumulative/allocation line?How to calculate?
- How to use A/D Line?
- What are the limitations of A/D Line?
- More investment technology indicators
what is Application cumulative/allocation line IntersectionHow to calculate?
The application cumulative/allocation line is combined price fluncuation and Trading volume, Calculate the daily capital flow to determine the accumulation (buy) or distribution (selling) pressure of the market.
The calculation of the indicator involves the closing price of the day, and the transaction volume relative to the highest and lowest price of the day.
The specific calculation method is based on the position of the closing price within the price range of the day, multiplied by the transaction volume of the day, and then added this value to the cumulative/allocation line value of the day before.
Step 1: Calculate the capital flow coefficient of the day (MFM)
Fund flow coefficient, English is Money Flow Multiplier, marked as MFM.
The capital flow coefficient is a proportional factor used when calculating the cumulative/distribution line.It measures the purchase or sales pressure of the day by comparing the closing price, highest price and minimum price of the stock.
The calculation formula is as follows:

It can be seen that MFM can be negative or equal to zero.
Step 2: Calculate the amount of funds on the day (MFV)
The amount of capital flow of the day was Money Flow Volume, which was marked as MFV.It was a calculation element in the cumulative/distribution line indicator.It calculated by the trading volume of the day by the Money Flow Multiplier.
MFV reflects the result of the combination of price changes and transaction volume on the day, which is used to measure the impact of the power of buying and selling forces on the market.Simply put, MFV is a quantitative representation of investors’ willingness to buy and sell stocks during the transaction activity.
Calculated as follows:

Step 3: Calculate A/D Line
A/D LINE = yesterday’s A/D Line + MFV of the same day
How to use A/D Line?
A/D Line’s change trend can be used to analyze the strength of the market.
The rise of A/D LINE usually indicates that the buying power in the market accounts for an advantage.If the price of a certain investment calibration rises steadily, and at the same time, its A/D Line also shows a continuous upward trend, which shows that the rise in prices has been supported by the actual transaction volume, reflecting the market’s positive views on the stock and strong willingness to buy.In this case, rising prices are considered persistent and may attract more buyers to participate.
Instead, the decline in A/D LINE usually indicates that the sales power in the market accounts for an advantage.
When using A/D LINE, you can also pay attention to the possible departure, mainly including: dialing away from the bottom.
A/D LINE’s top-back refers to a situation of high stock price, while A/D Line does not have a new high.This departure is usually considered a potentially drop signal, because it shows that despite the rise in prices, the weakening of buying power may indicate the decline in future prices.
What are the limitations of A/D Line?
As an indicator based on historical data, the application of cumulative/allocation lines still have lag.At the same time, abnormal changes in transaction volume may generate misleading transaction signals.
Therefore, it is best to combine A/D LINE with other technical indicators, while considering the fundamentals of the investment target.
More investment technology indicators
- What is Bollinger Bands?How to use the Bollinger belt?
- What is the application cumulative/allocation line? A/D Line
- What is the commodity channel index CCI?How to use the CCI indicator?
- What is a random shock index Stochastic ollator?
- What is the average trend indicator ADX?How to use the ADX indicator?
- What is a balanced transaction volume index?How to use the OBV indicator?
- What is a mobile average?MOVING AVERAGE
- What is moving average convergence?MACD
- What is the capital flow index MFI?How to use the MFI index?
- What is a relatively strong indicator?Relate Stringth Index
