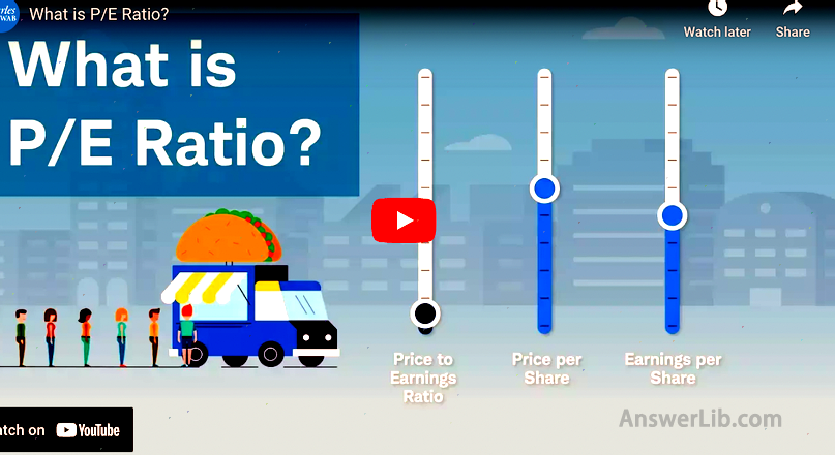
P / E ratio, English is P/E Ratio, yes P Rice-to- E armings R ATIO’s abbreviation indicates the company’s stock price Stock income The ratio between the between Per share price and Earnings per share The ratio.The price-earnings ratio can be regarded as the investment market for listed companies Extent Essence
The high price-earnings ratio indicates that the company’s stock is currently touted.A large number of investors have purchased this stock; the price-earnings ratio is low, indicating that the market is not interested in the company’s stock.At present, there are not many investors.
It should be noted that the price of the price-earnings ratio is not as good as good or bad.It is best to compare the historical price-earnings ratio data of the listed company, or compare the price-earnings ratio of different companies in the same industry, so that the value of investment guidance.
The following is the explanation of the price-earnings ratio of Charles Schwab:
- P / E ratio is an important indicator for guiding investment, but it is best to use Compare the historical changes of the company’s price-earnings ratio, Or use it for Comparison of P / E ratio of different companies in the same industry Items
- The price-earnings ratio expresses the investment market for stocks Extent What you need to pay attention to is the price-earnings ratio Trend, Not the current price-earnings ratio value;
- Basically, at the P / E ratio Historical low The stock of stocks will have a higher chance of subsequent increases, on the contrary;
- During the economic crisis, stocks that purchase low price-earnings ratios are even better Safety Items
- The price-earnings ratio cannot be used as the sole indicator of investment, you need to consider comprehensive consideration Earnings per share As well as Cash ratio As well as Interest coverage ratio As well as Profit margin There are many indicators to guide investment.
- use Futu Moomoo You can easily view the current price-earnings ratio and historical price-earnings ratio of listed companies.
Bleak American broker:Ying Diandai 劵| | Futu Moomoo| | Microex Securities| | Tiger securities| | First securities| | Robinhood in
Directory of this article
- How to calculate the price-earnings ratio?
- What are the types of price-earnings ratio?
- The price-earnings ratio of major technology companies
- How much is the price-earnings ratio?
- How to use P/E Ratio to guide investment?
- How to query historical price-earnings ratio data?
- What is the difference between P/E and PEG?
- common problem
How to calculate the price-earnings ratio?
The calculation formula of the price-earnings ratio is as follows:
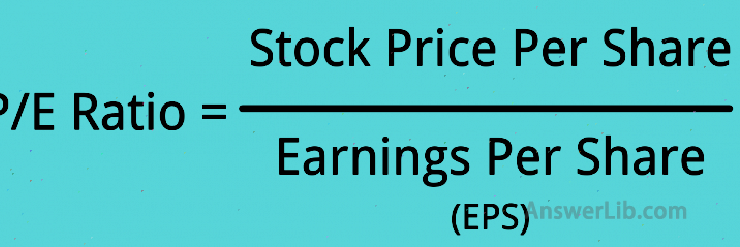
EPS The full name is E armings P errand S hare, that is Acceptance per share., Calculated as follows:
EPS = total number of shares of company income / issuance
For example, if a company’s stock transaction price is $ 100 per share, 100,000 shares are issued, and the company’s income is $ 400,000, then the company’s earnings per share (EPS) is $ 400,000/100,000 shares = $ 4/Stock, the P /E Ratio = $ 100 /$ 4 = 25 of the company’s stock P /E Ratio.
This means that every $ 1 for the company’s investment cost is $ 25, that is, based on the current company’s income, you need 25 years to recover the investment cost.
The higher the price-earnings ratio, the higher the ratio of the stock price compared to its income.The lower the price-earnings ratio, you can simply think that the cheaper the stock is.P / E ratio is one of the most widely used stock analysis data used by investors to make stock valuations.
As the price of a single stock or the entire stock market fluctuates, the price-earnings ratio is constantly changing.
The P / E ratio is an important tool for evaluating individual stocks or stock comprehensive indexes (for example, the Standard Purcera 500 Index).High -Powerful E ratio may mean that the price of the stock is very high for returns and is possibly of estimation.On the contrary, low price-earnings ratios may indicate that the current stock price is relatively low, and it may be underestimated.& nbsp;
When analyzing the value of stocks, in addition to tracking the changes in the price-earnings ratio of a single stock, you can also judge the value of the stock price by comparing the price-earnings ratio between similar companies in the same industry.
According to the price-earnings ratio, companies that issue stocks can be classified as “growth” or “value” companies.
- Companies that are higher than the average price-earnings ratio of the same industry are called “Growth” investment EssenceAmazon’s current price-earnings ratio is about 123, which is higher than the average price-earnings ratio of 64.65 higher than the retail industry, which is a growth company;
- Companies lower than the average price-earnings ratio of the same industry belong to “Value” investment EssenceThe current price-earnings ratio of Citi Group is less than 9, and the average price-earnings ratio of the banking industry is 13.5, which is regarded as a “value” company;
What are the types of price-earnings ratio?
When calculating the price-earnings ratio, but when the price or income of different periods is used, the meaning of the P / E ratio is different:
1.TTM P/E ratio (Trailing Twelve Month P/E Ratio)
When calculating the price-earnings ratio, if the earnings per share (divide) use the company’s total income over the past 12 months, the price-earnings ratio calculated here is called TTM P / E ratio Essence
TTM P / E ratio uses the earnings data obtained by the company to calculate the P / E ratio, so it can be used as an objective and accurate value when evaluating the company, rather than subjective prediction values.
TTM P / E ratio is the most popular P / E ratio index because it is the most objective.
However, the TTM price-earnings ratio also has its deficiencies, that is, it is impossible to indicate the company’s future price trend.At the same time, if the company suddenly occurs major events, the stock price fluctuates abnormally, at this time the TTM price-earnings ratio may not be accurately displayed in the past.
Many financial websites, such as Google Finance and Yahoo Finance, All use TTM P / E ratio.Popular investment application Ying Diandai 劵,, Futu Moomoo and Robinhood, Also use TTM P / E ratio.
2.Forward P/E Ratio
The long-term price-earnings ratio uses the company’s future operation status and stock price prediction to give data.It can be used to calculate the company’s future income valuation, and it can also show the company’s predictive judgment on the company’s performance in the next year.Morningstar This method is used.
The disadvantage of this method is that investors may blindly invest because the company deliberately exaggerates its future trend.According to US Securities and Exchange Commission Law, if the company exaggerates future returns and is not regulated by civil liability, it will be exempted from investors who have been filed by investors who have been purchased by stocks based on unrealistic forward-looking guidance.
Some investors will comprehensively judge the pursuit of China P / E ratio and long-term P / E ratio.If the long-term price-earnings ratio is lower than the tracking of the P / E ratio, it means that the income may increase; if the long-term price-earnings ratio is higher than the tracking of P / E ratio, it indicates that the income will decline.
3.The Shiller P/E Ratio
Schille, Also known as ” Periodic adjustment of P / E ratio“( CyClically Adjusted P/E Ratio), Marked as CAPE, is the average income of using the company for a period of time, also known as Periodic adjustment of P / E ratio of periodic adjustment Essence
Schiller’s PT-profit ratio was first proposed by the Robert Shiller of Yale University that the earliest was used to measure the valuation of the entire stock market.
The calculation method of Shiller P/E Ratio is to remove the stock price Over the past ten years of Average earnings per share And adjust according to inflation.
Schiller Pixels = ten-year average of the current stock price / inflation adjustment adjustment per share
Schiller’s price-earnings ratio is widely used to measure S & P 500 Index The valuation of the S & P 500 Index is currently slightly higher than 30.
The price-earnings ratio of major technology companies
Here are the TTM price-earnings ratio of several technology companies:
Listed company | TTM P / E ratio (October 2022) |
|---|---|
| TESLA | 69.98 |
| Apple | 25.75 |
| Amazon | 89.78 |
| Meta (Facebook) | 11.13 |
| 23.93 |
How much is the price-earnings ratio?
The price-earnings ratio is a value.It is difficult to say that how much P / E ratio is the best, and it will only play a role when there is a comparison object.
At the same time, P / E ratio Not very suitable Periodic industries, such as aviation, real estate, finance and other industries.
When investors use the price-earnings ratio analysis company’s stock price, they often consider many different companies in the same field to compare their P / E ratio.
For example, the transaction price of stock A is $ 30, and the transaction price of stock B is $ 20.It seems that stock A is more expensive, but combined with the price-earnings ratio can help investors to determine which one of the two is cheaper from the perspective of valuation.& nbsp;
Here we calculate the price-earnings ratio of stock A and stock B in combination with the income (EPS).
- Stock A: Stock price = $ 30; EPS = $ 2; P/E raito = 15
- Stock B: Stock price = $ 20; EPS = $ 1; P/E raito = 20
According to P/E Ratio judgment, stock A may be more suitable for purchase, because the price-earnings ratio of stock A is lower and the income per share is higher.So when investing, Can’t just judge the investment value of the stock through the stock price Essence
In addition, it is worth noting that, The price-earnings ratio of different industries will be different,一些行业的平均市盈率较高,而另一些行业的平均市盈率较低,所以, Cross-industry comparative price-earnings ratio is not significant It is often impossible to reflect its comparison.
At the same time, the price-earnings ratio is only one of the many valuation indicators and financial analysis tools used to guide investors to make investment decisions.It should not be the only one.It may also need to consider the following indicators:
- P/BV (Price to Book Value) market ratio; net rate;
- EV/S (Enterprise Value-to-Sales) corporate value sales ratio;
- EV/EBITDA (Enterprise Value to the Earnings Before Interest, TAXES, Depreciation, and AMortization Ratio) corporate value and interest-tax ratio;
- P/AFFO (Price/Adjusted Funds From Operations) The price/adjustment of funds after adjustment;
- P/CFPS (Price to Operating Cash Flow Per Share) price/operating cash flow ratio;
- PEG RATIO (Price/Earnings-TO-GROWTH RATIO) price-earnings ratio growth rate and other values.
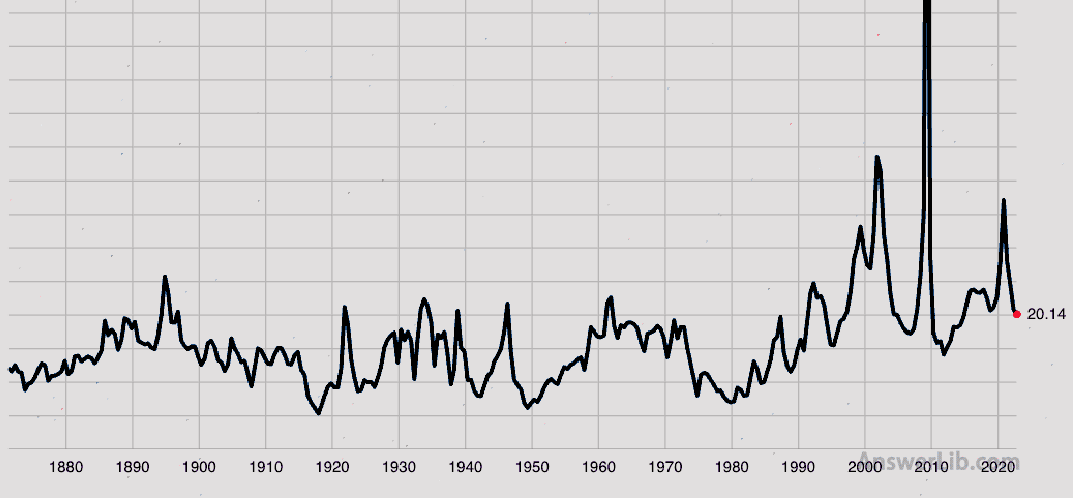
P / E ratio can also be used for calculation US stock index For example, the P / E ratio of the S & P 500 Index, thereby evaluating the situation of the entire stock market.In October 2022, the P / E ratio of the Standard S & P 500 Index was 20.14.
How to use P/E Ratio to guide investment?
For how to judge whether a stock is worth buying based on P/E value, investors can judge based on the current P/E Ratio value of the stock and its long-term average level value.
For example, a company’s stock price in 2022 is $ 30, and the average long-term average earnings per share (EPS) in the past is $ 2.Then, the long-term average price-earnings ratio of this stock is 15.
If the company’s stock price in 2023 is still $ 30, but due to the increase in sales of the company, its earnings per share rose to $ 2.5, so that the company’s price-earnings ratio is currently reduced to 12.
So, the price of this company’s stock is currently cheaper than the long-term price, because the income per share has increased, and the company’s stock price has not changed, indicating that its price-earnings ratio is reduced, which is when buying.
另一种根据市盈率来判断股票价格是太贵、还是便宜的方法是,与同行业的其他企业比较,比如,如果您想投资生产饼干的公司股票,整个饼干生产行业的平均市盈率是10,而If the price-earnings ratio of a biscuit production company is 15, then the company’s stock price is expensive.
emphasize again: P / E ratio is a need to pass Compare To reflect the value of its value guiding significance, and this value will be affected by many factors, not high, it means that it is too expensive, and low means cheap.
What can high price-earnings ratio indicate?
The listed company of high price-earnings ratios is often regarded as a “growth” company.Because its stock price is often sought after by investors, the stock price is often very high.
Robert Johnson, a franchise financial analyst at the New York Economic Index Association, said: “The higher P / E ratio is usually handled with growth stocks.” “Usually, high price-earnings ratio stocks have higher growth expectations than low price-earnings stocks.”
Therefore, many investors will choose “growth” stocks, but this is often not the choice of value investors.
However, if the price-earnings ratio of a stock is significantly higher than the price-earnings ratio of similar companies in the same industry, and even higher than its own historical price-earnings ratio, this may indicate that the stock is overvalued.Because of the calculation method of the price-earnings ratio, the overestimated stock price will be expensive.Make the price-earnings ratio very high.
For how to judge whether a high price-earnings ratio stock is worth investing in growth stocks, or whether it is not worth investing in overestimated stocks, it can be comprehensively judged from other aspects, such as whether the company’s hype, or the company has sufficient capabilities.Let investors believe that they will get high returns in the future.
What can low price-earnings ratio indicate?
Low price-earnings ratio may indicate the company’s current stock price underestimated It’s right.Of course, this is a good signal of buying stocks, and it is expected that the future price will rise to reflect the potential value of the company.
On the contrary, low price-earnings ratios may also indicate that the company is not worth investing, because investors have made stocks that make the stock price decline higher than the reduction of income, which will naturally lead to a decline in the price-earnings ratio.
It should be noted that it does not mean that it is underestimated because a stock is sold at a relatively low price-earnings ratio, because investors are willing to be pessimistic about the future income of the stock.
Therefore, the stocks of low price-earnings ratio need to analyze the company’s income to further analyze whether its low price-earnings ratio value is worth investing or indeed either a stock that is not worth investing.
How to query historical price-earnings ratio data?
You can pass Macrotrends Come to check the history of the listed company is the price-earnings ratio:
For example, let’s search for the historical price-earnings ratio of Apple:
step one: Log in to Macrotrends main station, and then enter the stock TICKER (code).
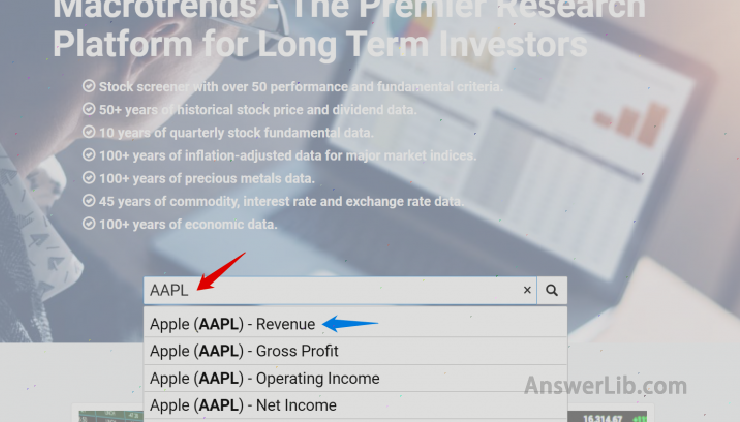
Step 2: In the AAPL option, select “Price Ratios”
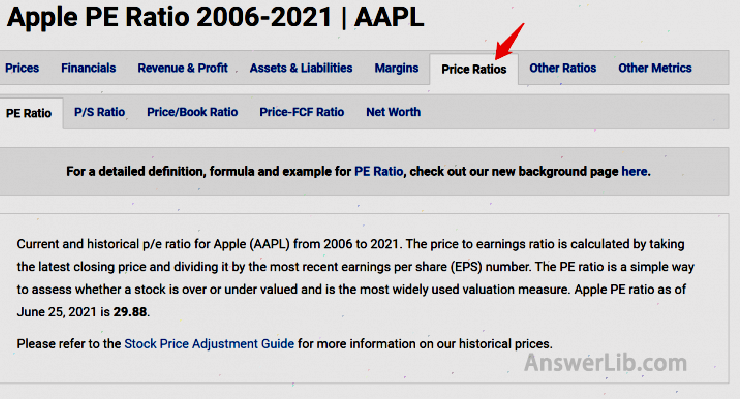
Step 3: Continue to the Scroll page, you can see the Apple stock price, TTM Net EPS, and the Pe Ratio of our relationship

What is the difference between P/E and PEG?
PEG The full name is: P Rice/ E ARNINGS-TO- G rowth, that is, P / E ratio growth rate, It can also be called a dynamic stock price income ratio.
The calculation method is, The ratio of the price-earnings ratio of the stock to the growth rate of net profit growth The net profit growth rate can be an estimated earnings growth rate, or the average profit growth rate for a period of time.
usually think, The value of the stock with less than 1 is underestimated Because compared with the company’s expected profit growth, its price is considered low.and PEG is greater than 1 and may be considered overestimated Because compared with the company’s expected income growth, the stock price is too high.
However, if a company provides dividends (divided), PEG may not be applicable to these companies, because the PEG ratio is not considered.
Compared with the price-earnings ratio, PEG provides more complete company operating analysis or estimates.Some analysts or investors believe that PEG can more accurately evaluate the true value of stocks than P/E, because the price-earnings ratio does not take into account the company’s profitability.Condition.
common problem
Question 1: What is the price-earnings ratio English?P/E ratio English is P/E Ratio, which is & nbsp; P Rice-to- E Arnings & nbsp; Ratio& nbsp; abbreviation.
See More
The price-earnings ratio is used to indicate the proportion of the company’s stock price and stock income, which is the ratio of the stock price to EPS.Among them, EPS: The full name is the Earnings Per Share, that is, the company’s earnings per share, the income obtained by the shares of the company/the corresponding number of issuance shares.
See More
When calculating the price-earnings ratio, there are mainly the following three:
1.TTM P/E ratio -Trailing Twelve Month P/E Ratio
2.Long-term P/E ratio -Forward P/E Ratio
3.Schiller P/E ratio -The Shiller P/E Ratio
See More
PEG RATIO, the full name is: Price/Earnings-To-Growth Ratio, that is, P / E ratio growth rate, It can also be called a dynamic stock price income ratio.Compared with P/E RATIO, PEG RATIO provides more complete company operating conditions analysis or estimation.Some analysts or investors believe that PEG RATIO can more accurately evaluate the true value of stocks than P/E Ratio because the price-earnings ratioNo considering the company’s profit.
See More

