The month-on -month and year-on -year are a common comparison analysis method for financial indicators.
The month-on -month includes: Month Over Month, or Month on Month, and Quarter Over Quarter, or Quarter on Quarter).
The year-on -year year-on -year year-on -year, English is Year Over Year, or Year on Year.
The biggest difference between the three is the different values used for calculation:
- Monthly uses monthly data of different spans.For example, compared with the previous month, or compound calculations on the values of recent months, etc.
- The quarter-quarter -on-month comparison was used to compare the values of this quarter and the previous quarter.
- The year-on -year year-on -year comparison is used in two years.For example, compared with the values of the first quarter of this year and the value of the first quarter of last year.
Regardless of the month-on -month or year-on -year, the comparison method is to subtract the latter value off the previous value, and then remove the previous value, turn the result to the percentage value, or remove the latter value after the previous value, minus 1 and then transform and then transformIt is a percentage value.
Relatively speaking, the results of the analysis are more detailed, and more fine changes can be found by calculating, such as to measure various monthly data released by turnover, unemployment rate, and consumer price index.
The year-on -year considers a larger time span effect, and at the same time remove some details of influencing factors, such as quarterly factors, which are usually used to consider more macro data such as annual profitability and GDP.Of course, it can also be used to measure the unemployment rate and other data.Test the significance of the value change from different perspectives.
Bleak American broker:Ying Diandai 劵| | Futu Moomoo| | Microex Securities| | Tiger securities| | First securities| | Robinhood in
Directory of this article
- What is the difference between MOM, QOQ, YOY?
- How to calculate MOM, QOQ, YOY?
- MOM, QOQ, YOY use examples?What are the guidance effects on investment?
- More investment foundation
What is the difference between MOM, QOQ, YOY?
Among the three ratios, MOM and QOQ are the month-on -month, which are called “monthly month-on -month” and “quarter-month -old”, respectively, and are used for comparing the continuous single monthly and single quarter values.
YOY is a year-on -year, which can compare a monthly value, single quarter or single-year value, but the time span is a whole year, that is, one month, or a certain quarter, or a whole year of the two years.
1.Monthly month-on -month (MOM)
The month-on -month calculation method of calculating value changes accounted for the percentage of the previous month.
Monthly can be used to analyze various fine value changes, such as the growth of stock prices, monthly sales revenue of enterprises, and website visits.Because the monthly values are produced monthly, densely monthly kitchen values will appear in the process of operation or economic development.After making data analysis charts, you can observe the development process of economic activities more intuitively.At the same time, the month-on -month month-on -month analysis of the business progress of the start-up company and the effectiveness of various new strategies in time, but for mature companies, the use of quarter-quarter or year-on -year use is more meaningful.
With the development of the monthly value, the volatility of the value is large, and it is easily affected by various events, such as holidays and natural disasters, which will directly affect the monthly calculation value of the month.
Therefore, analysts can summarize some information by tracking and analyzing monthly values.For example, when when the year, sales will increase, and in the future development, it needs to expand inventory in advance.
For the month-on -month month of the foundation, some people believe that it cannot accurately estimate the return on investment, and then hopes that through the data with longer time span to obtain the month-on -month growth rate, to estimate the future income volume, at this time they will use the compound monthly growth rate (Compound Monthly Gropth Rate, referred to as CMGR).After getting CMGR, investors can use a specific company to estimate the possible benefits in the future.
The calculation method of CMGR is:
Cmgr = (the value of the last month in the cycle)^^(1/month difference)/ (Value of the first month in the cycle) – 1
For example, CMGR is used to calculate the compound monthly growth rate of a company in the past 5 months:
| month | Number of new members |
|---|---|
January | 10 |
February | 12 |
March | 20 |
April | 35 |
May | 50 |
The company’s compound monthly growth rate in these five months is:
Cmgr = [50 ^(1/4)/ 10] – 1
= 5^(1/4)– 1
= 49%
Use CMGR to calculate the way to benefit in the future::
The current month value x (1 + cmgr)^Monthly difference
After two years of estimated time limit, the number of new members that the company can get in May:
New membership number = 50 x (1 + 49%)^twenty four
= 50 x 1.49^twenty four
= 716,870
CMGR can help investors estimate future growth through a certain time span growth rate, but when used, there are many restrictions:
- The calculation results of CMGR will increase with the amount of index level.When the basic value is small, you can get a more reasonable amount of growth.For example, in the above distance, with 50 new users as the basic calculation value, 716,870 new users can be obtained in the same month after 2 years.Member increase.
- When the multi-fluctuating monthly change value is calculated using CMGR, a serious assessment deviation will occur.For example, in 5 months, 30 new members will be obtained in one month, and 60 new members will be obtained next month.90 new members.Under such a large fluctuations, the use of CMGR will get a relatively evaluated value, but it cannot truly reflect the high fluctuation risk of the business.
- CMGR is suitable for the calculation of compound interest growth model, and does not apply to the calculation of the single-profit growth model.For some investment with interest as a source of income, the calculation principle of CMGR is suitable for compound interest growth, that is, as time progress, benefits will grow faster.For single-profit growth, CMGR provides a wrong calculation result.
2.quarter-quarter -quarter (QOQ)
The quarter-quarter -quarter-quarter quarterly-three -month quarterly quarterly, the ratio of various values, such as the operating profit of the first quarter compared with the previous quarter.
上市公司都必须每季度发布一次财务报告,也就是10-Q报告,所以企业管理者可以借助10-Q表格来进行业绩的季度环比分析,以评估当前策略是否达到了预期的运营收益,并根据In the performance of continuous season, adjust the operating strategy in a timely manner to obtain better operating results.For example, through the quarter-quarter increase rate of different products in summer and winter, it determines the types of products sold in different seasons.
Investors can calculate the quarterly quarterly quarterly calculation of various business indicators in the financial report.
For the trend of the stock price, some investors will also calculate the quarter-quarter calculation.According to the change in the ratio of the ratio of the rise and fall rate, the stock price is estimated to reach its peak or the bottom of the valley, as one of the reference indicators to determine investment decisions.
Because most economic data and financial data will present quarterly differences, in the analysis of the changes in various types of economic and financial values, the month-on -month utilization rate is higher than the monthly month-on -month.In the quarter-quarter -quarter-quarter -quarter-quarter -quarter-quarter -quarter-month results of financial analysis with more value.
3.year-on -year (yoy)
The year-on -year considers the growth rate of financial data with longer spans.It can consider the year-on -year year-on -year year-on -year year-on -year year-on -year year-on -year.
Compared with a month-on -month, the advantage is that it can measure the significance of data changes within a longer period of time, and at the same time exclude the impact of some accidents on the analysis of operating ability, or the impact of seasonal factors on financial analysis.
For example, for a company, sales in December have increased much compared to November.The results of this month-on -month look like the company’s profitability has increased, but it is clear that this result is affected by the holidays of Christmas.Therefore, the company’s profitability growth should be analyzed in December, that is, analyzing the sales growth rate of sales in December and December last year, thereby analyzing the company’s profitability more fairly in the same background.
Similarly, if the performance of a month-on -month performance decreases by 5%, the year-on -year performance increases by 10%.This is a good data for enterprises.The decrease of the month-on -month decrease may be caused by the characteristics of the industry, and the year-on -year increase is the embodiment of the increase in corporate profitability.
For government, central banks and other institutions, it has the same meaning year-on -year, that is, to measure economic growth or decline in similar economic backgrounds, to eliminate the impact of seasonal factors, etc.Price Index CPI, GDP GDP, unemployment and interest rates.
So the difference between the three is:
| Month-on -month MOM | Quarter-quarter QOQ | Year-on -year Yoy | |
|---|---|---|---|
Calculation cycle | Every month | every quarter | Every month, every quarter or every year |
Cycle span | Consecutive month | Consecutive quarter | The same period of consecutive years |
Significance | According to the timeline, the changes in the monthly financial values of the month | Depending on the timeline, the changes in the financial value of each quarter | The same cycle in consecutive years |
Characteristic | Very detailed analysis of the changes in financial data; It will be affected by various events; | Analyze the changes in financial data in the quarter as a unit; It can present obvious seasonal changes; | Measure the change of financial data with longer time span; It can avoid the impact of accidents on data changes; It can reflect the significance of value changes more integrated; |
How to calculate MOM, QOQ, YOY?
The month-on -month calculation method is:
The percentage of a month-on -month growth = (this month-last month value)/ last month value x 100%
The month-on -month calculation method is:
Percentage of a month-on -month growth = (value of this quarter-last quarter value)/ last quarter value x 100%
The year-on -year calculation method is:
The percentage of year-on -year growth = (value of this year’s specific time period-value of the same time period last year) / Value of the same time period last year
MOM, QOQ, YOY use examples?What are the guidance effects on investment?
The following is Apple 10-Q The net income in the financial report is Net Income for example calculation.
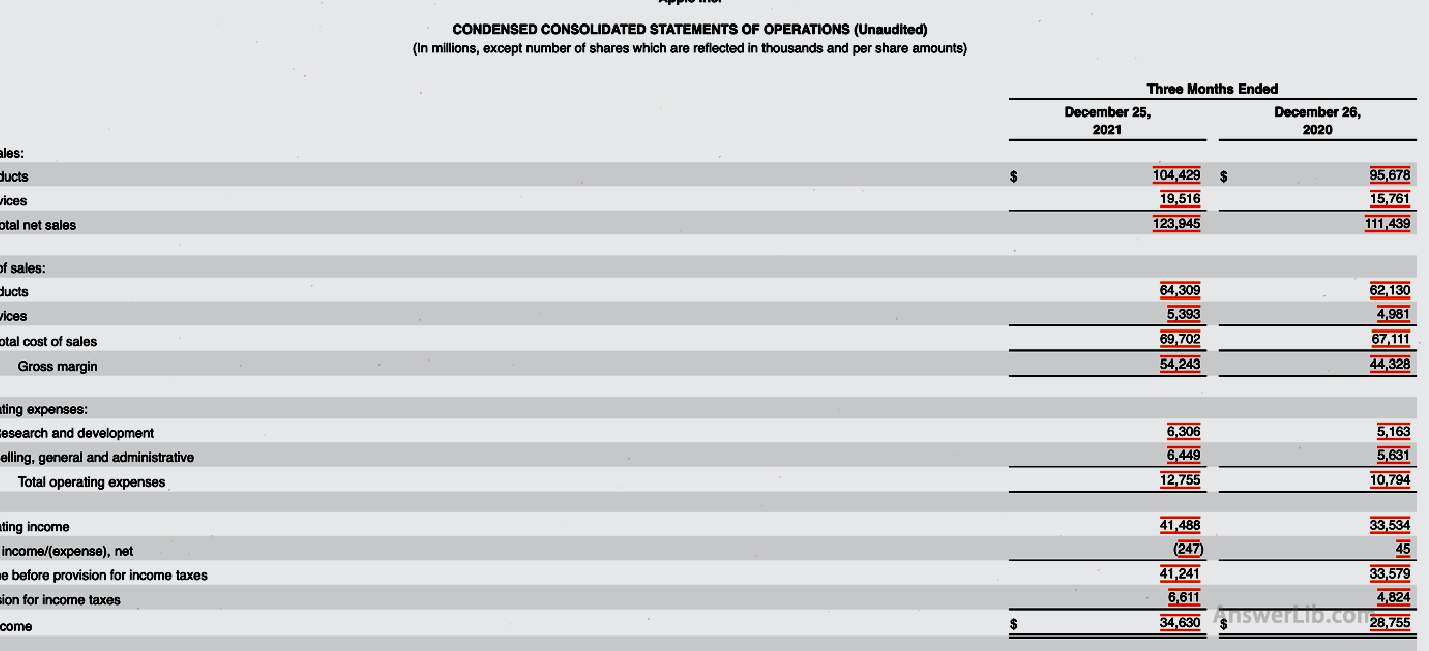
The following is the profit and loss statement of Apple’s first quarter of 2022 and the fourth quarter of 2021:
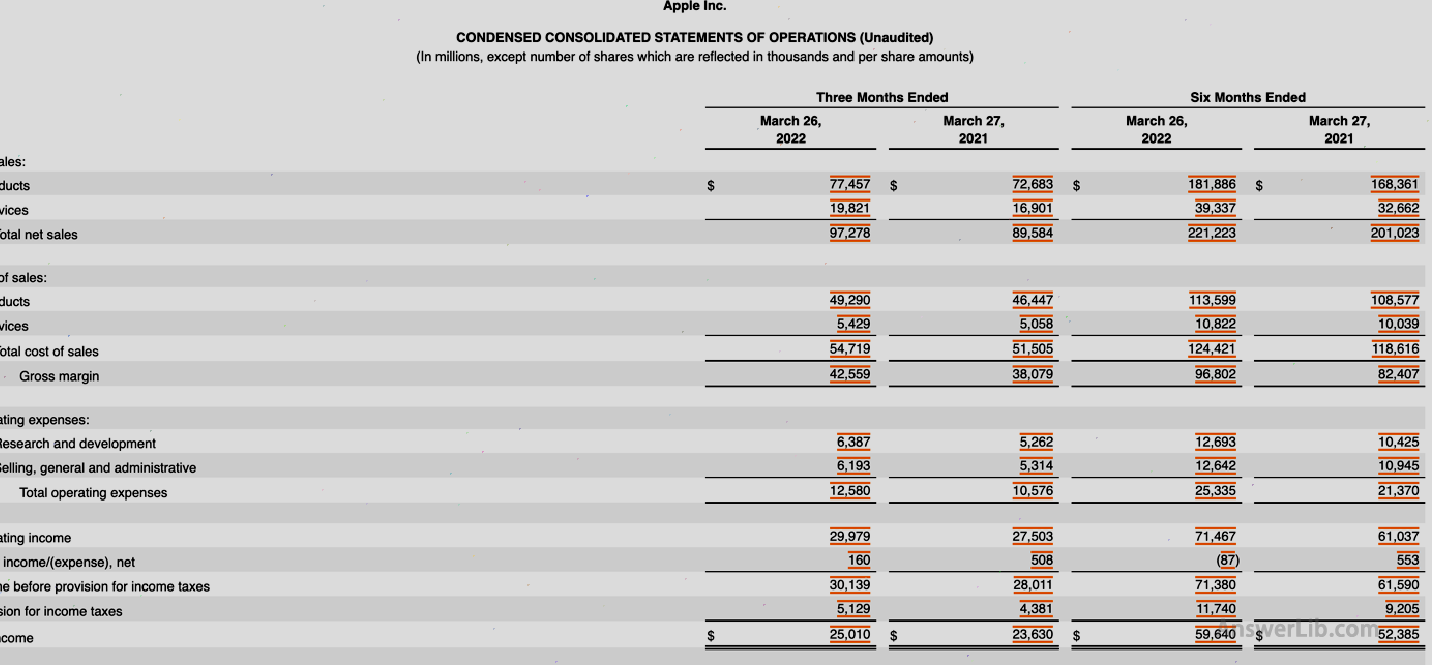
You can see from the financial report:
- The net income in the first quarter of 2022 is: $ 25,010 m
- The net income in the first quarter of 2021 is: $ 23,630 m
- The net income in the fourth quarter of 2021 is: $ 34,630 m
Therefore, for the net income in the first quarter of 2022:
- Quarter-quarter = ($ 25,010 m -$ 34,630 m)/ $ 34,630 m x 100% = -27.78%
- Annual year-on -year = ($ 25,010 m – $ 23,630 m)/ $ 23,630 m x 100% = 5.84%
It can be seen from the calculation results:
In the quarter-on -quarter, Apple’s net income in the first quarter of 2022 declined.This may be related to the various holidays in the fourth quarter, such as Black Five and Christmas, and the rate of change of 27.78%, indicating that Apple has achieved good sales in the 2021 promotion event.
According to a year-on -year analysis, the net income in the first quarter of 2022 increased.This shows that Apple has increased its sales capabilities in a similar sales environment.
For investors, although the growth rate of the first quarter decreased, in general, Apple’s profitability is still increasing.At the same time, because Apple is a mature large company, it can still be considered to put it in itself into its ownIn the investment portfolio.
More investment foundation
- What is a necessary return?Required Rate of Return
- What is the American Commodity Futures Trading Commission?CFTC
- What is a credit default? Credit Default Swaps
- What is “oil dollar”?Petrodollar
- What is technical analysis?Technical Analysis
- What is fundamental analysis?Fundamental Analysis
- What is short transaction?Short Selling
- Year-on -year VS?MOM, QOQ, YOOY
- How to query financial institutions to hold positions? FORM 13F
- What is mortgage support bond?Mortgage-back security